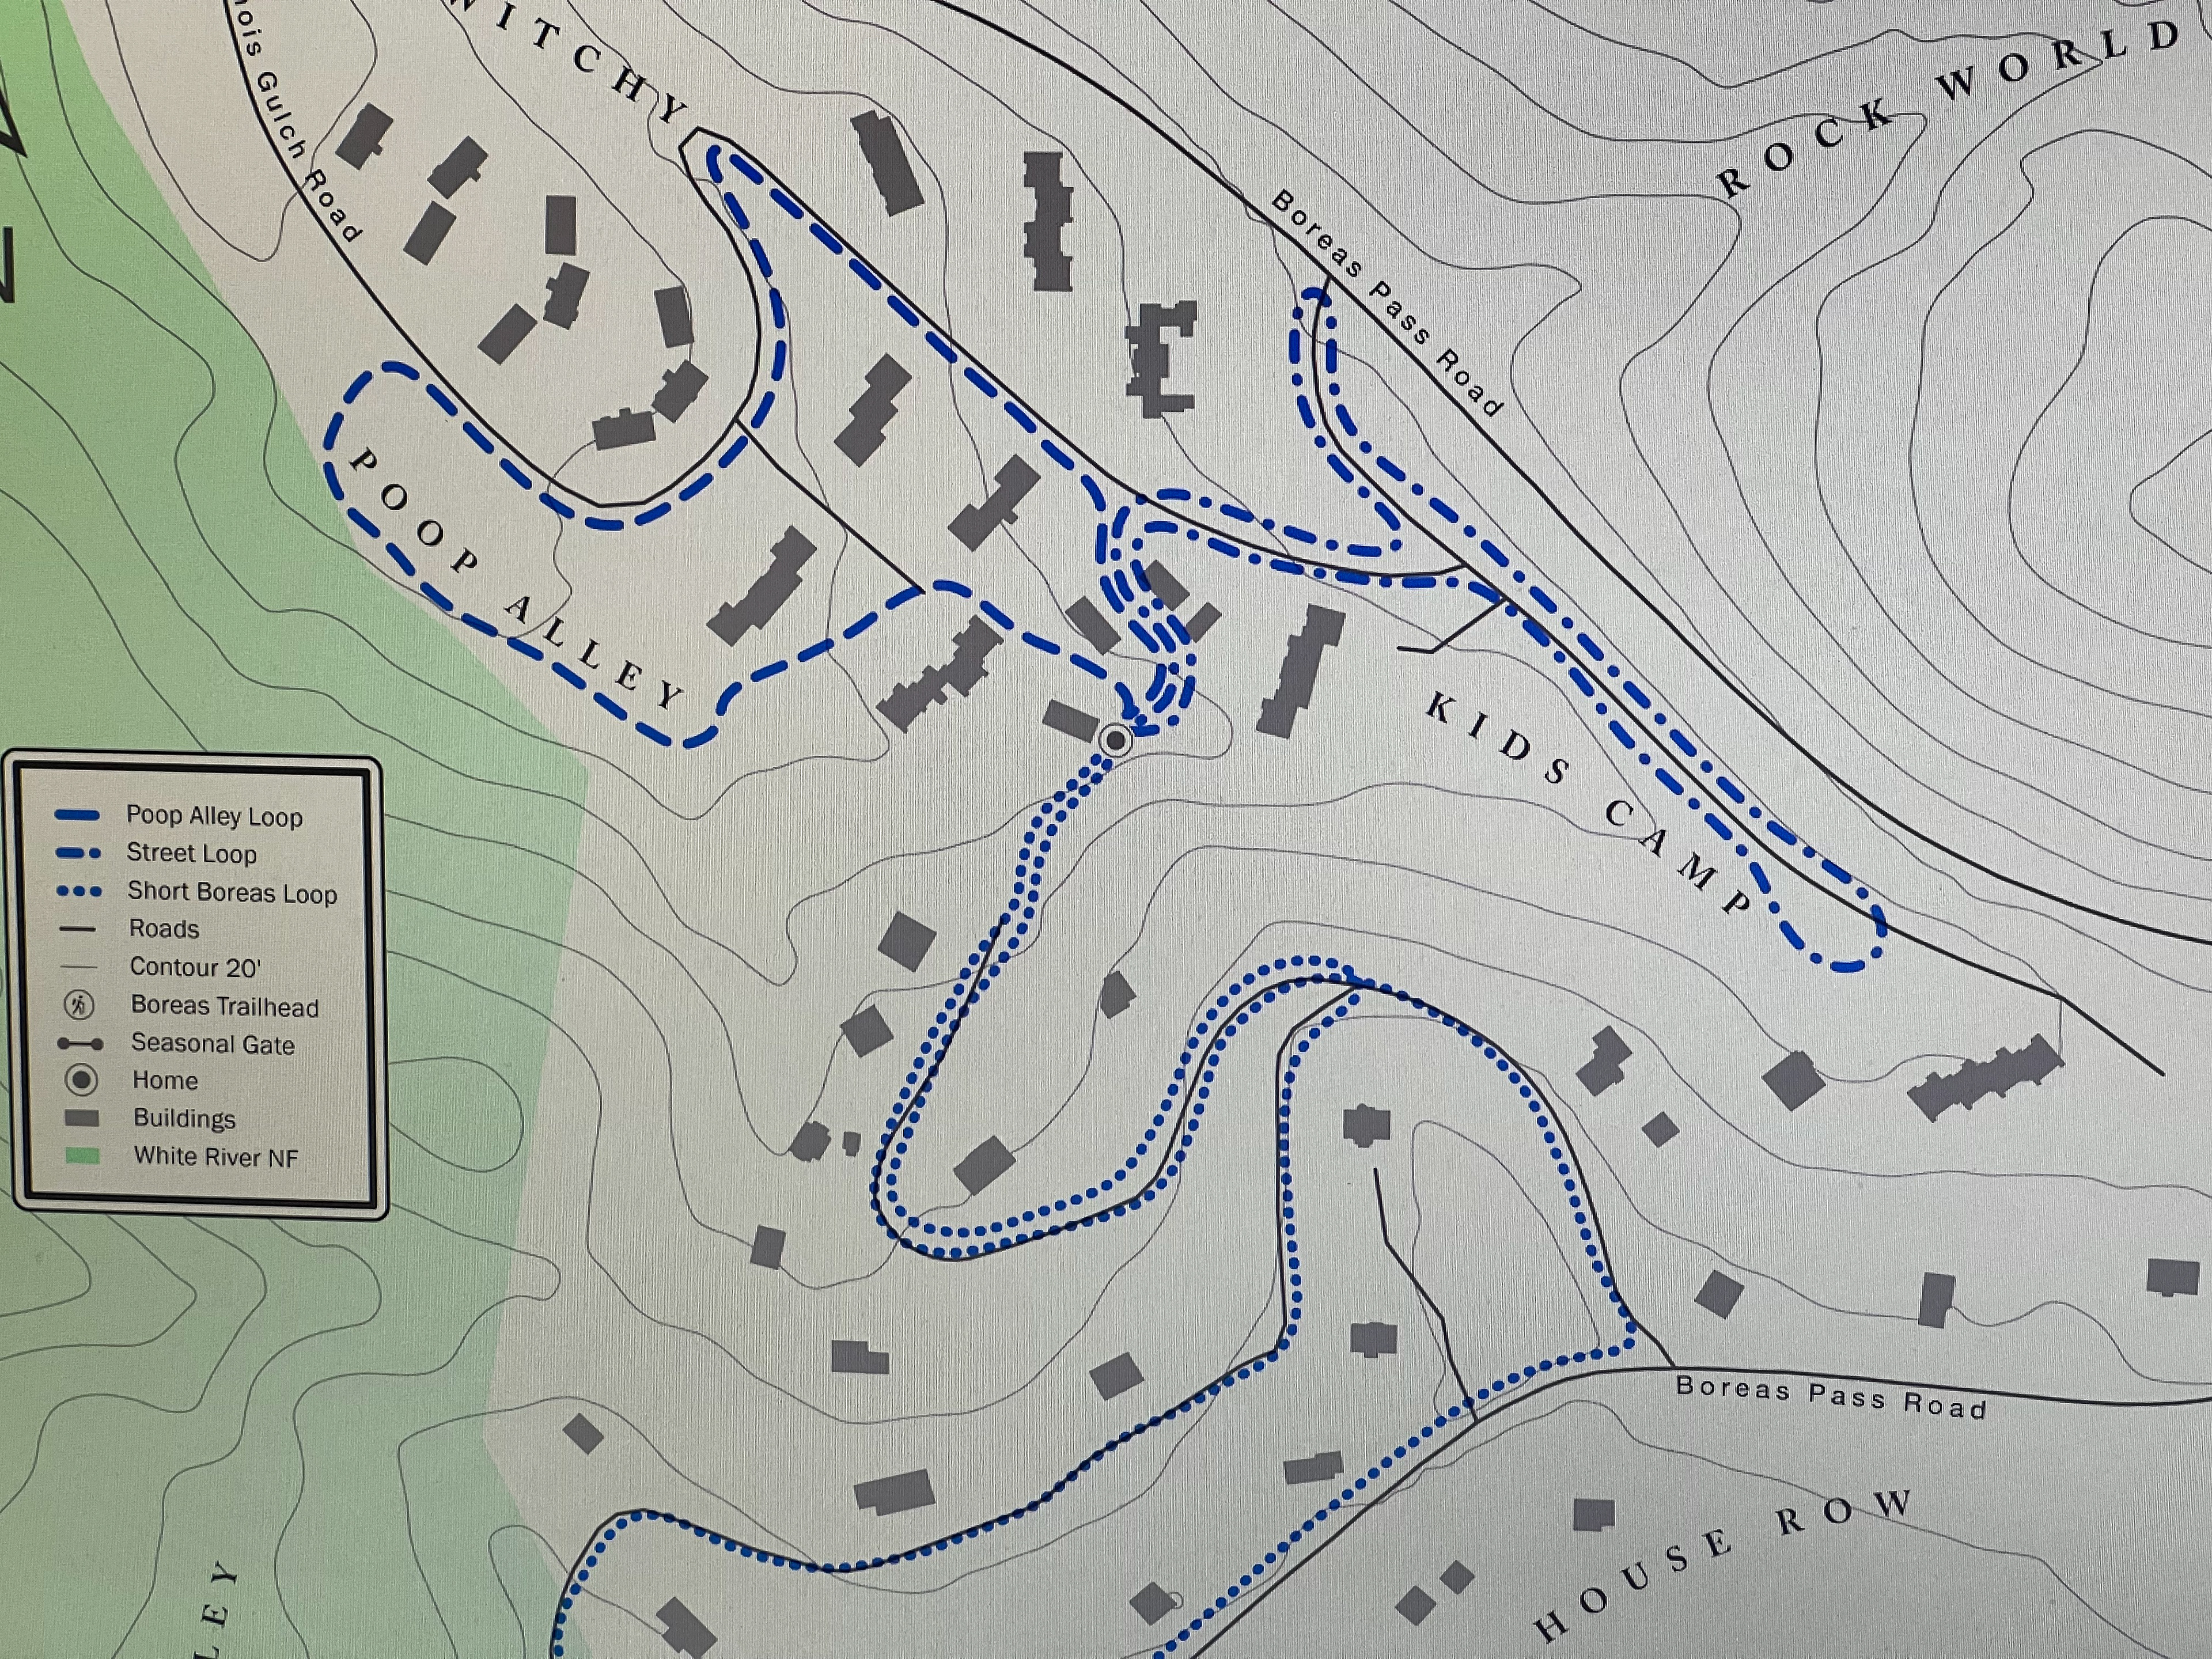
On a clear fall morning I took Riley on his three main walks, within two hours (he was happy for that), with my iphone 13, running Avensa in track mode, in my breast pocket. The GPS device was not on the dog.
I recorded three solid point tracks to work with. The point data was converted to line data. And once those three tracks were in ArcPRO I built the base map. Previous Summit County road data and forest boundaries were brought in. I got DEM data from the USDA. I was able to build contour lines with that, and the elevation profiles with the original captured point to line data. A new feature layer of the buildings was georeferenced from another basic basemap. I “softened” the line data for cartographic purposes and built new symbology for those lines. The labeling and titling was done by hand in photoshop as well as my little portrait of Riley in the corner.
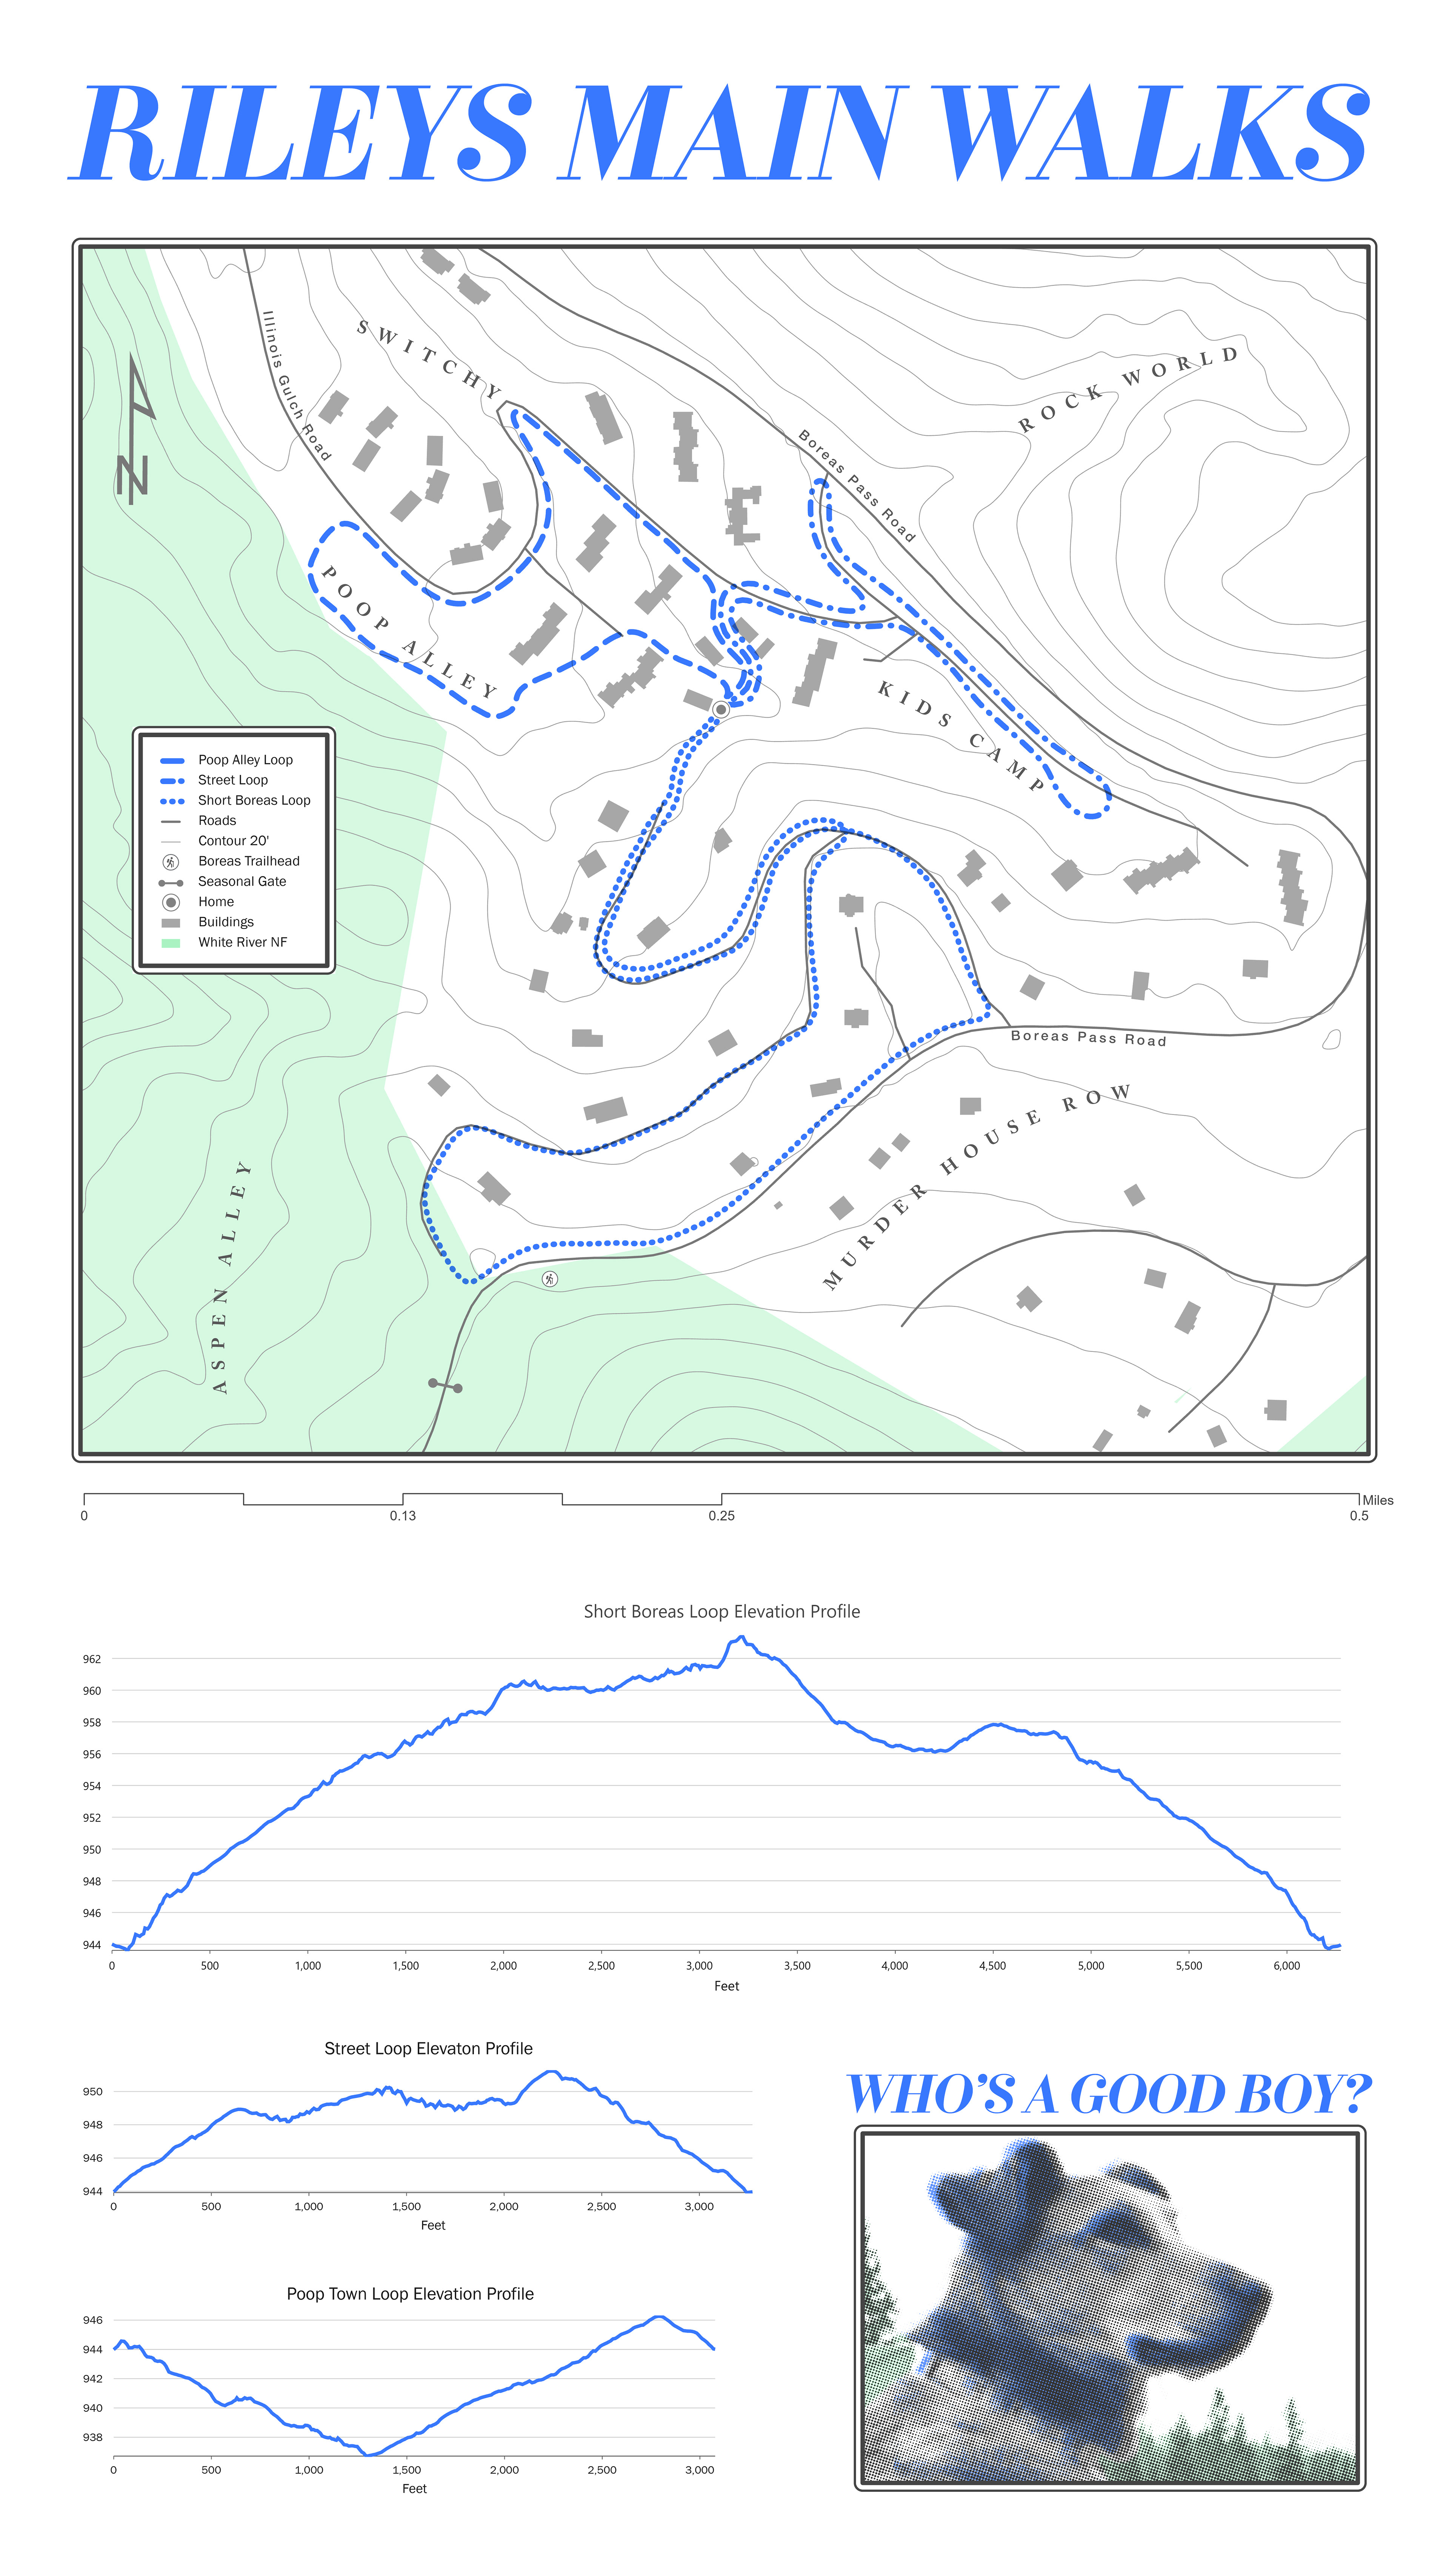
Not much ArcPro based analysis, but the map does provide some insights. I believed Street Loop was shorter than Poop Alley, turns out it is just a bit longer. I also believed that Street Loop had a larger elevation gain than Poop Alley, it doesn’t. Now my action item after reviewing this map is that I need to extend Street Loop down to “switchy” to make it a bit longer. That way I’ll have three Riley walks, Poop Ally Loop which will be approximately a quarter mile, Street Loop at a half a mile and Little Boreas Pass Loop which is around a mile.